
Imagine playing for a Division III college program where coaches receive real-time, easy-to-interpret data on their athletes’ readiness and fatigue levels.
The information, unlocked with a few computer keystrokes, would allow coaches to examine trends in player fitness, spark conversations with athletes, and reduce the risk of injuries.
This isn’t technology that might be available in the near future. It’s a cutting-edge resource accessible to Big Red coaches right now thanks to the work of five Denison data analytics majors and varsity athletes.
The five student-athletes — Jordyn Maurer ’26, Jack Williams ’26, Jack Rollo ’27, Max Fishbein ’26, and C.J. Geier ’27 — have spent the past two years developing a dashboard that will give Big Red teams a competitive advantage in preparation and player maintenance.
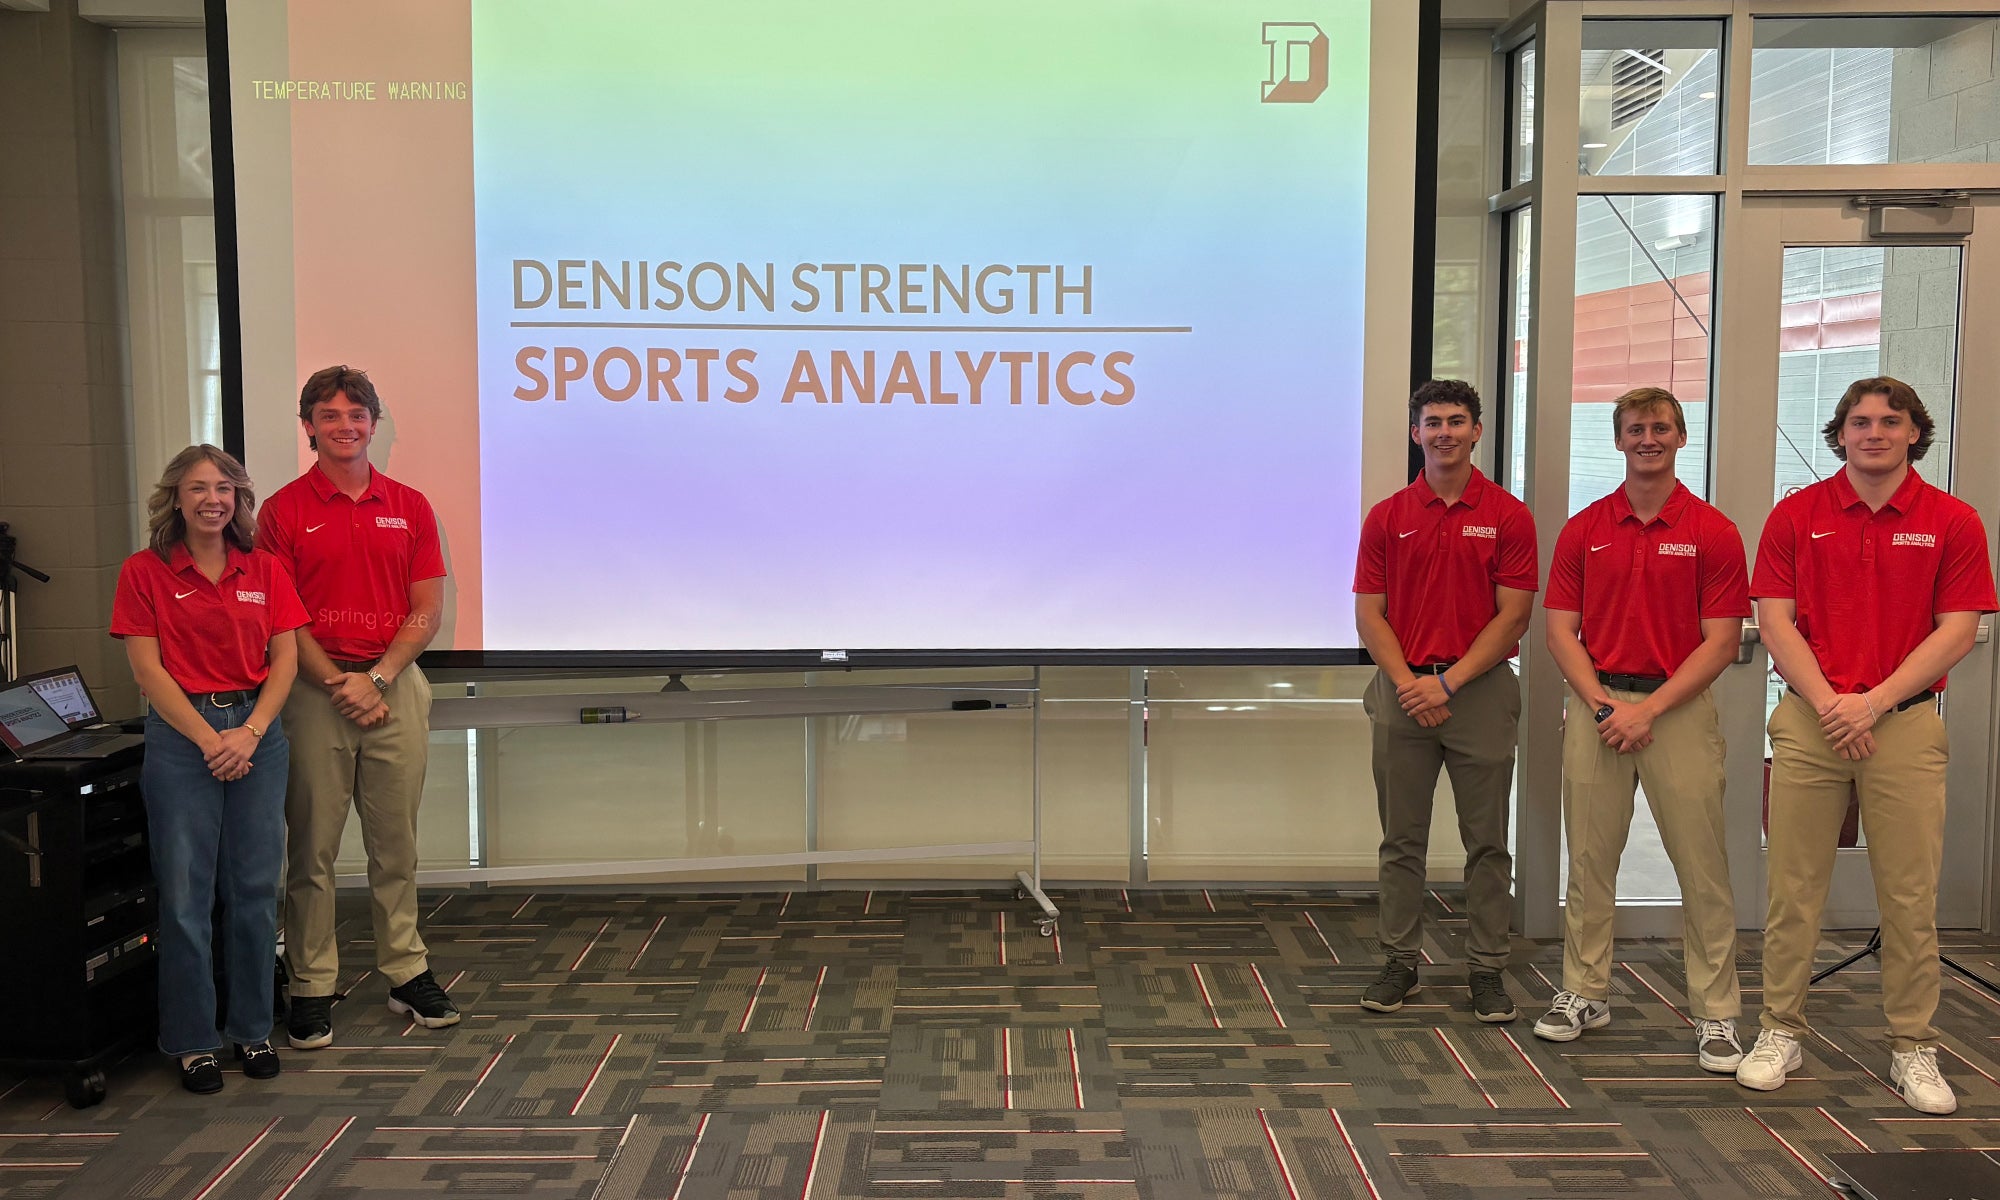
The five data analytics students — Jordyn Maurer ’26, Max Fishbein ’26, Jack Rollo ’27, Jack Williams ’26, and C.J. Geier ’27 — at their dashboard presentation.
It arrives at a time when Denison athletics is winning NCAA titles and thriving on the national stage at unprecedented levels.
“I can’t say enough about the work of these five students,” says Beau Scott, director of high performance at Denison. “In creating this dashboard, they are allowing us to do things that aren’t even being done at some Division I schools. It’s pretty incredible.”
Denison ranks fourth among the most innovative liberal arts colleges in America, according to U.S. News & World Report.
In recent years, the university’s athletics department has given data analytics students real-world experience, hiring them to collect and interpret data that helps coaches make informed decisions regarding player fitness. Women’s basketball point guard Abby Cooch ’27, a member of the NCAA championship-winning team, is among those analyzing player load — a wearable-technology metric that quantifies physical effort by measuring acceleration in all directions: forward and backward, side to side, up and down.
“Experiences like these, while serving as a perfect complement to Denison’s sports analytics concentration, give students a meaningful advantage as they enter the highly competitive sports analytics job market,” says Associate Professor Emily Marshall, director of the King Center for Data and Innovation.
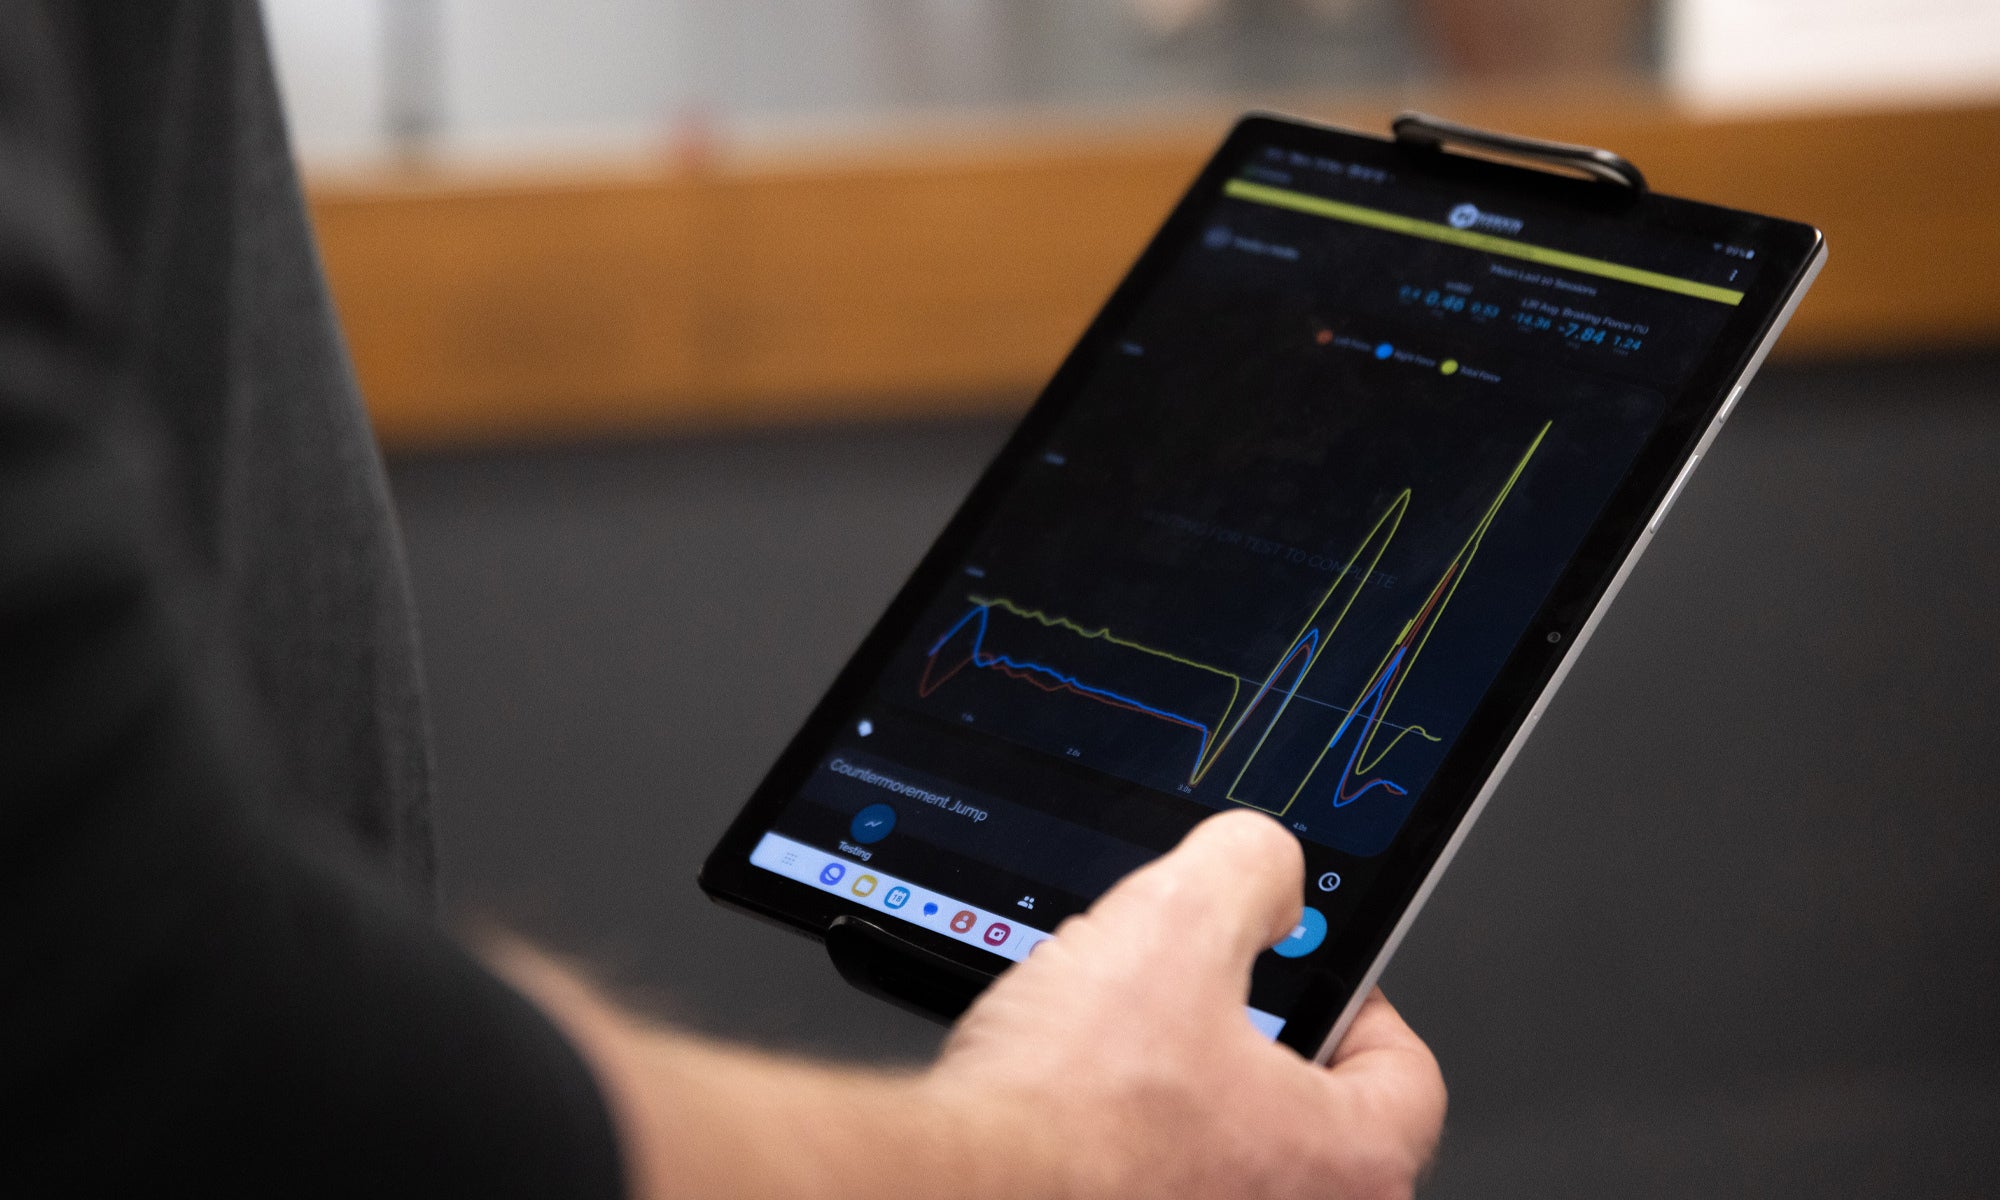
The development of the Denison Sports Performance Dashboard, which uses data from force-plate technology, is the latest example of the university’s commitment to innovation. A data analytics dashboard is a visual tool that consolidates, organizes, and displays key performance indicators, metrics, and data points from various sources on a single screen.
“One of my favorite parts about the Denison academic and athletic community is that you wouldn’t know the students are varsity athletes,” says Matt Tanney, an associate vice president and director of athletics at Denison. “It’s such an integrated experience. They melded academic interests with a strong understanding of sport performance and created a project that cuts across disciplines with tremendous utility.”
Scott began employing data analytics students in 2019. As head of the Big Red strength and conditioning program, Scott and his staff work with about 650 varsity athletes during an academic year.
He uses the data collected and analyzed to develop programs designed to keep athletes in peak condition. He and his staff relay the findings to their coaches.
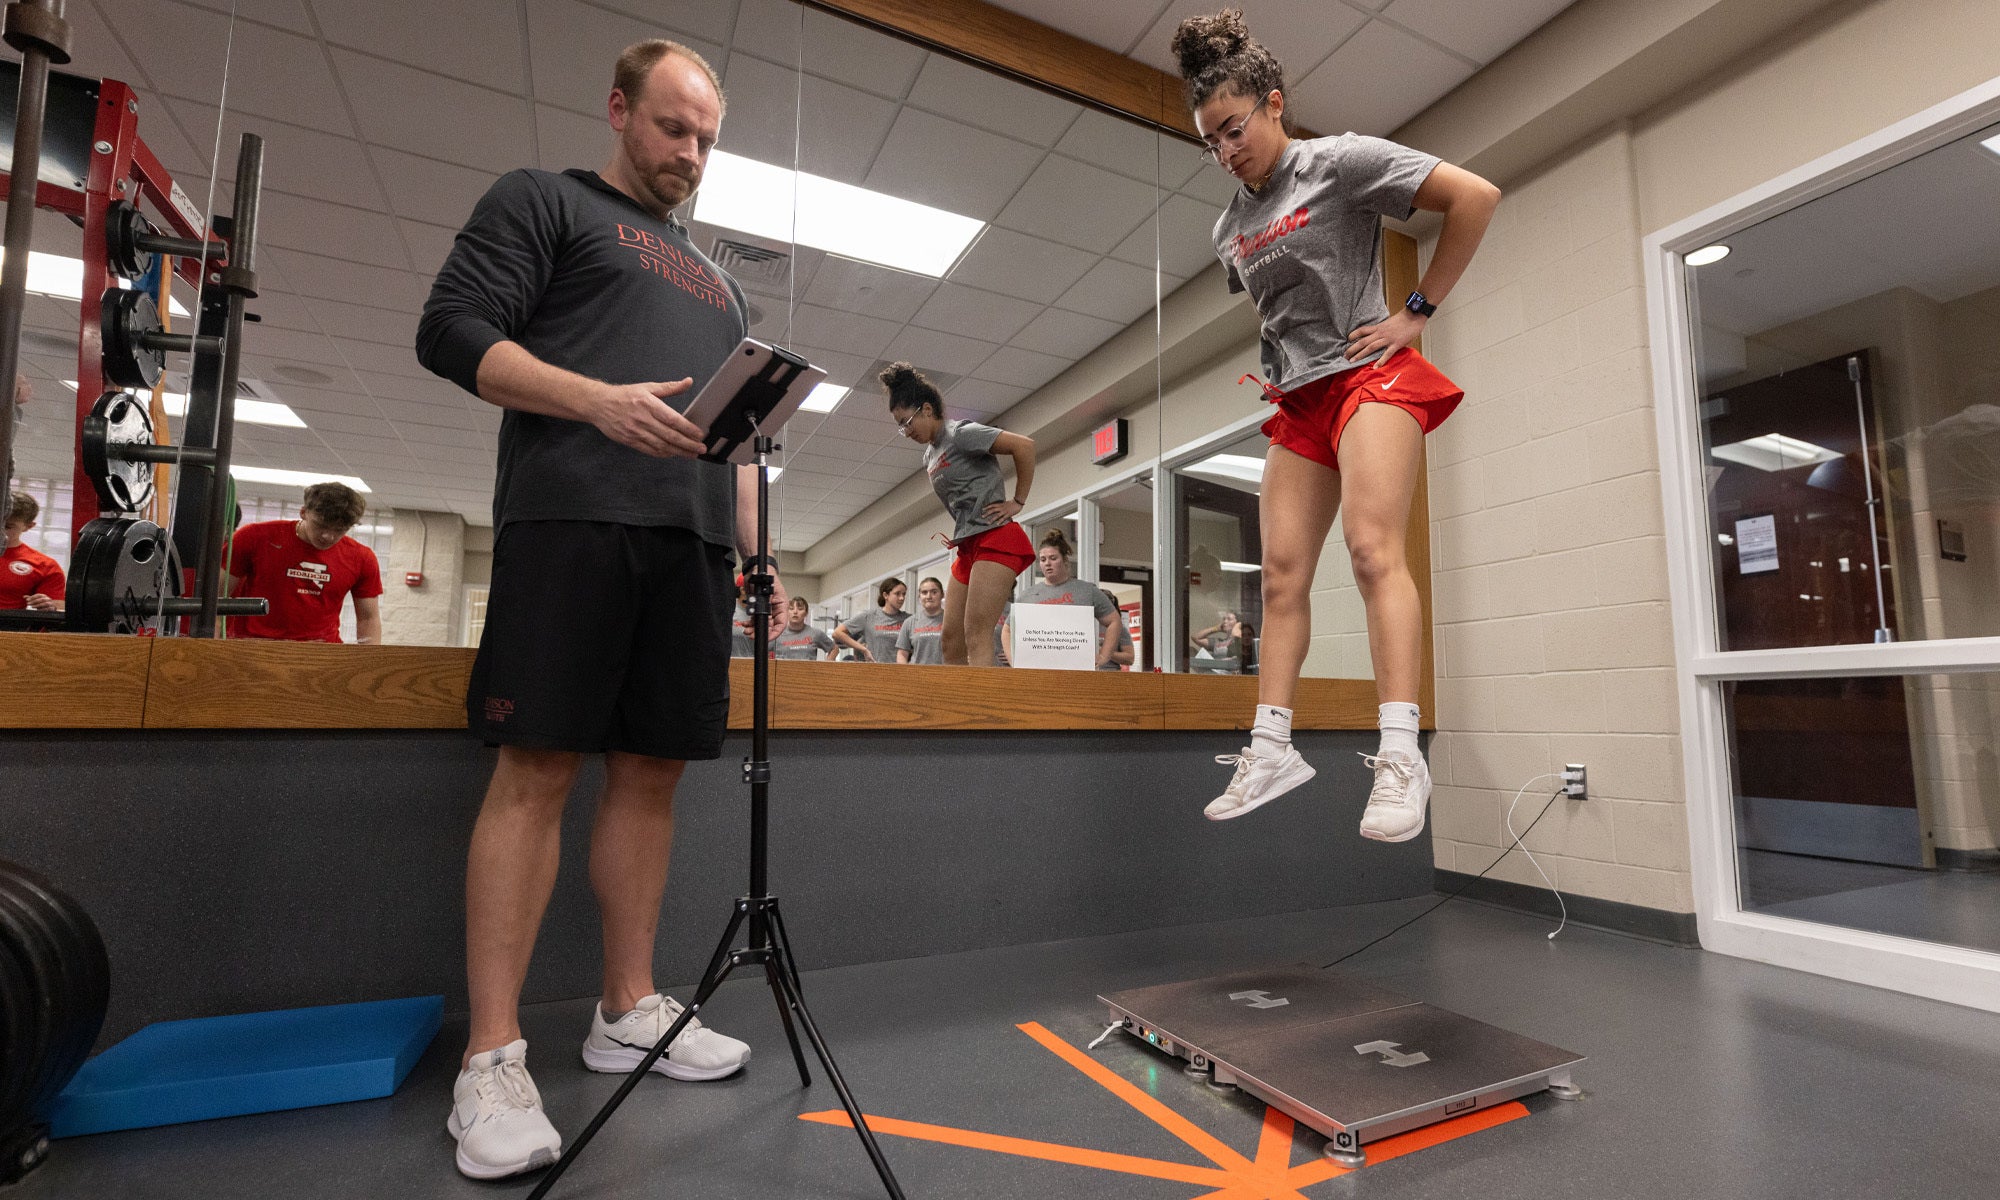
Three years ago, the university purchased its first of two force plates — platforms equipped with sensors that measure the ground reaction force exerted by athletes. Scott has Denison athletes jump on the force plates twice a week, in and out of season.
The technology provides 80 metrics, including insights into a player’s athletic capacities, force generation, fatigue status, rehabilitation and return-to-play progress, and left-to-right asymmetries.
“There are no other Division III teams that are jumping on force plates with the consistency that we are,” student-athlete Fishbein says.
But most coaches don’t have time to peruse all that data and make sense of it. They have practices to run and games to win. It’s why Scott has hired his team of student data analysts. They have worked on various projects, trying to deliver useful information that coaches can easily absorb.
“This project exemplifies what makes Denison’s approach to learning about data and technology so distinctive,” Marshall says. “The work these students produced is remarkably sophisticated, not only because of the technical challenges involved, but because they successfully translated complex performance metrics into a tool that is intuitive, actionable, and immediately valuable for coaches.”
In April, the five students presented the Denison Sports Performance Dashboard to a room full of Big Red coaches and administrators at the Mitchell Center.
As students jumped on the force plates, the coaches could see the results almost instantaneously on the dashboard. Using the dashboard, coaches can monitor trends and check out an athlete’s readiness data. Game statistics and injury history are also available.
An athlete’s current fitness is classified in three colors: green, yellow and red. If athletes are performing in the red, a coach might want to ease up on their training, or at least talk to them to determine why their fitness levels are headed in the wrong direction.
“The idea is for coaches to have conversations with their athletes,” Geier says. “Stress is stress, no matter the source. Are the athletes getting enough rest? Athletes, especially at the Division III level, have really heavy course loads on top of the sports they play.”
“We’re just trying to prevent injuries and maximize performance, while also making sure the athletes feel like they are being heard,” Geier adds. “It’s better to be safe than sorry in terms of these conversations.”
Denison coaches were impressed with the student-athletes’ presentation and excited about the dashboard’s potential.
Men’s soccer coach Brandon Bianco said the dashboard provides valuable context that’s been lacking in force-plate data evaluation. It will also help coaches have more objective conversations with athletes regarding fitness levels.
“Everything for us is about finding improvements on the margins,” Bianco says. “And if the improvements we can make through a dashboard like this lead to better decisions about our athletes and their readiness, it’s certainly a good thing.”